InContext and Program Flow
In the 1990’s, I was attending Graduate School and working 30+ hours per week. I was working as a temp, so I would be able to have a flexible schedule to accommodate classes and study time. Most of the work assignments I received were for less than one week.
One week, I was sent to a very small company for “office work.” The company did economic research and data analysis for Congressional Lobbyists. I did some simple graphics, data analysis, computer programming and document assembly work.
Because they liked the results of my work, my “week” was continuously extended for about two years – until they finally hired me as a full time, regular employee. (Before that time, their company’s work was limited to short term contracts).
The company (Program Flow) got a large contract and leveraged the work they were doing for clients into the publication of three books. The books were published by Congressional Quarterly (which no longer exists).
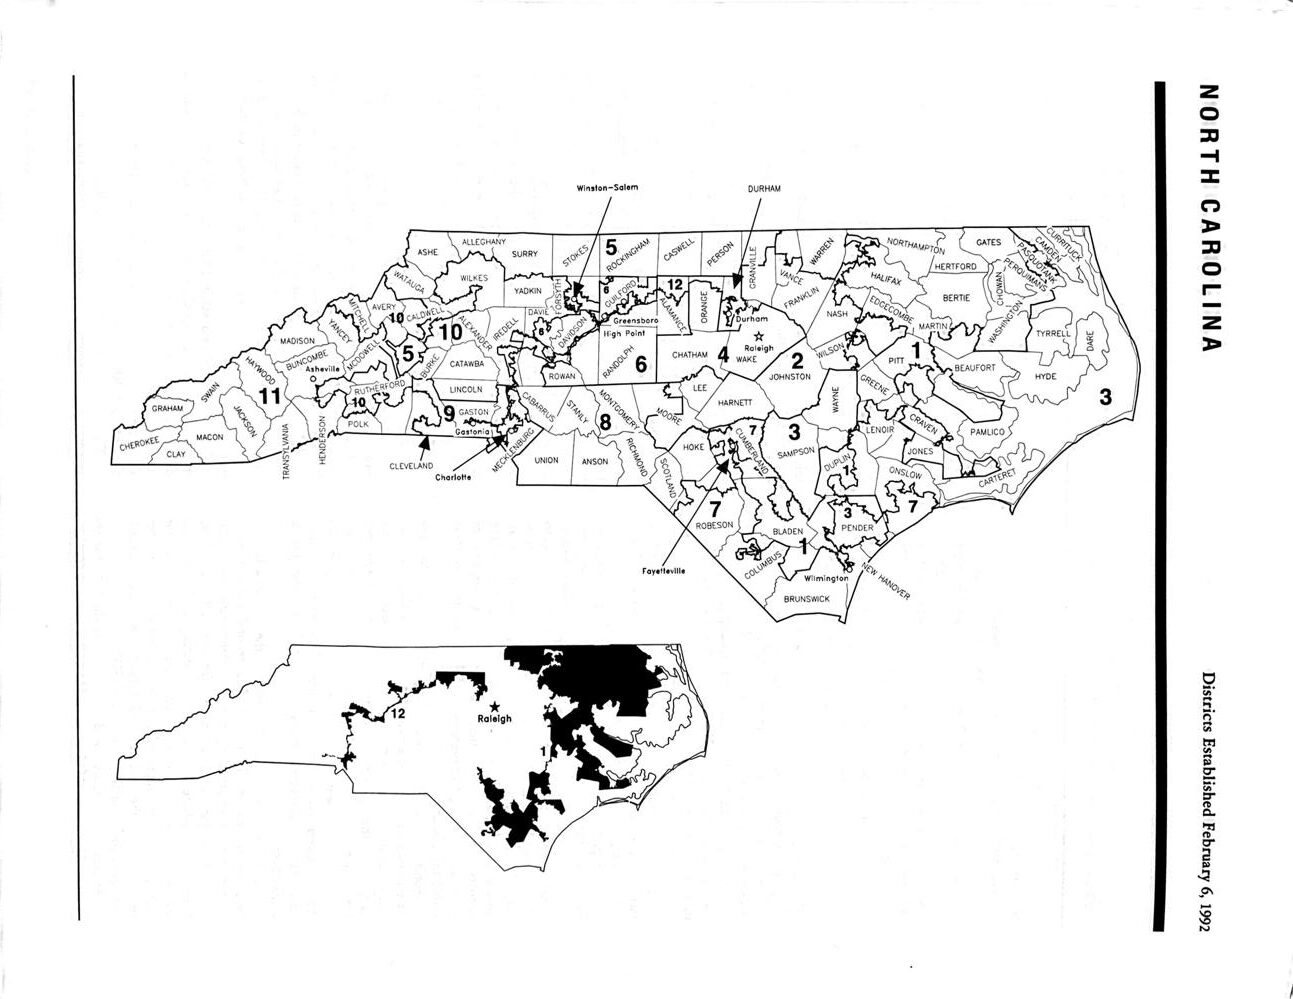
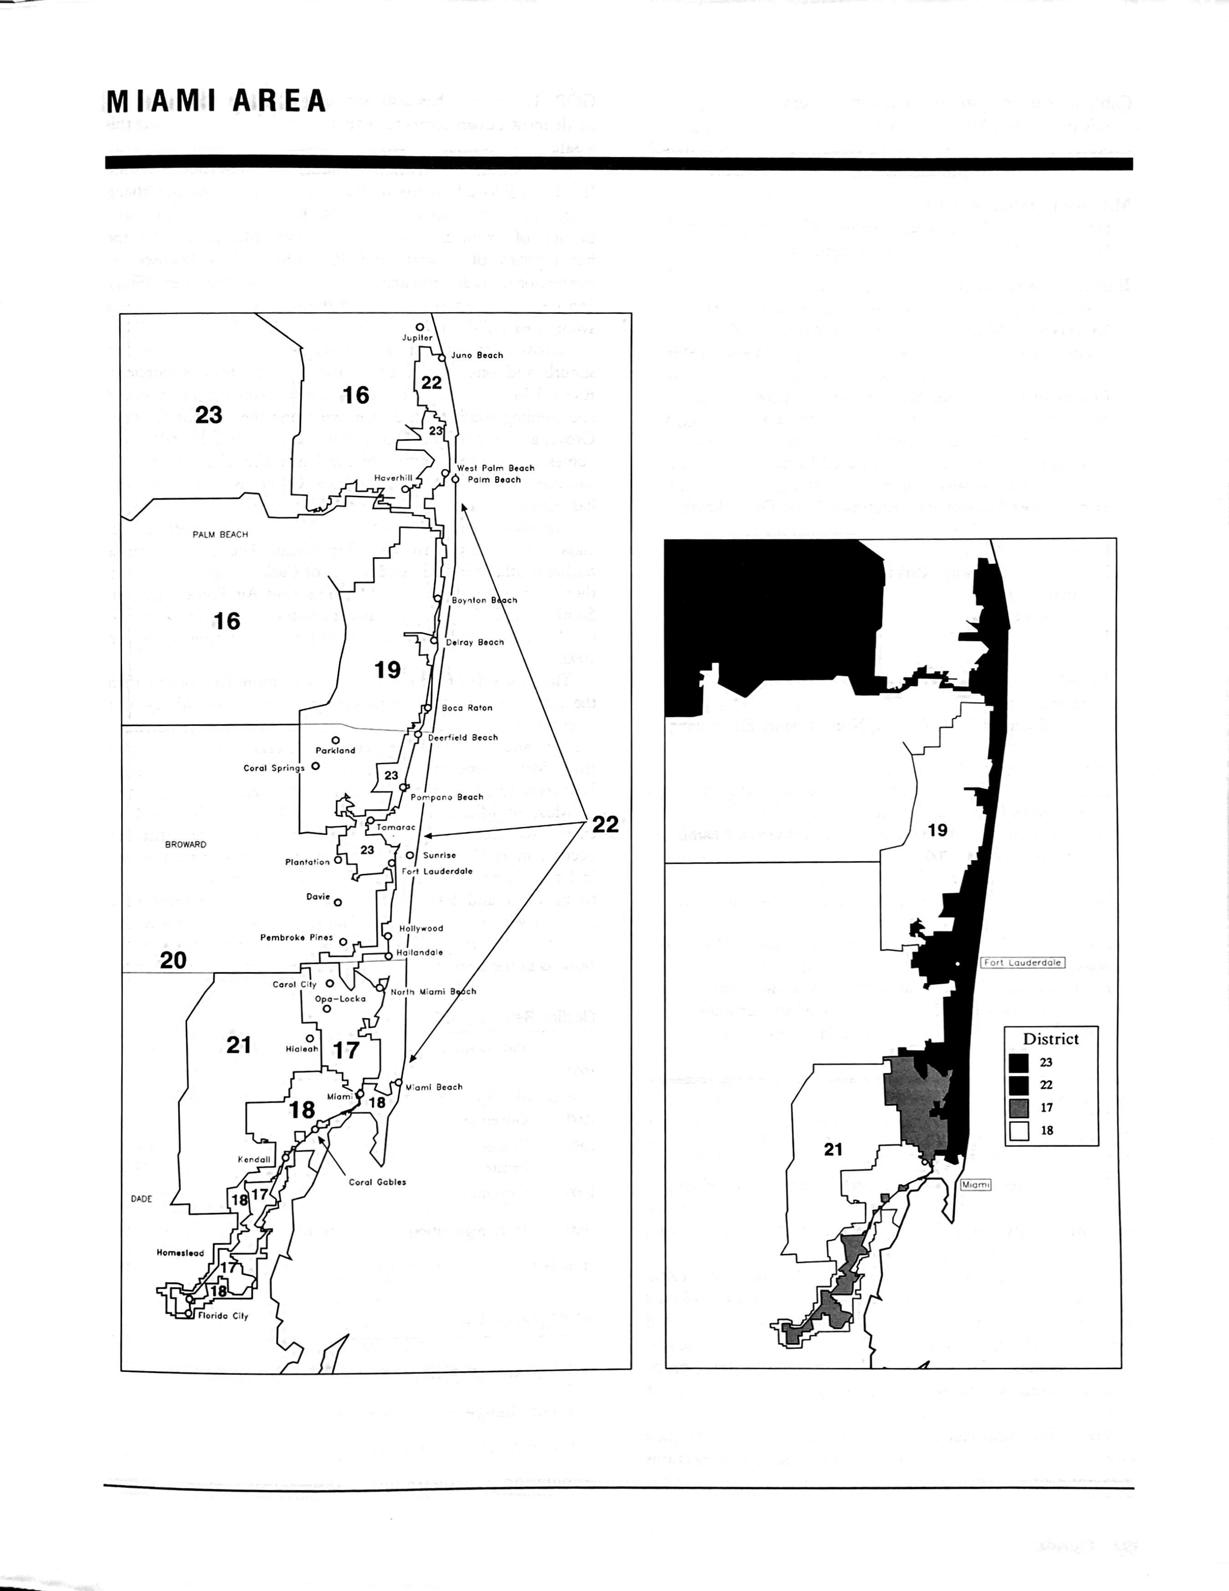
The first book involved the simplest work load for me. The book contained an analysis of US Congressional Districts, following the 1990 Census and subsequent re-apportionment and re-districting. My work was producing black and white line drawing maps of Congressional Districts, state by state. The majority of the work in the book was done by Congressional Quarterly staff. While I did not receive individual credit for my work, the company I worked for was listed in the credits.
This digital mapping was done in the very early days in the commercial use of GIS (Geographic Information Systems). We were using Atlas GIS software, which no longer exists. The geographic files for the Congressional Districts were purchased. All I had to do was convert the file structure into the type needed for our software, separate the maps into individual states, and prepare labels for the graphics to be printed, finally exporting the grapics in a format that the publishing software could use.
After that book was finished, the REAL work for us began. It took more than two years to complete all the data analysis and creation of maps for the next two books. The next two books contained maps and demographic tables for the 6,743 State Legislature Districts in the US. I was the person responsible for CREATING the geographic files, on a state by state basis, for the entire country. In addition, I aggregated a MASSIVE amount of census data that was compiled into hundreds of tables.
Most states have two houses in their state legislatures with differing boundaries. That amounts to a total of 93 digital state maps that had to be CREATED. EVERY state involved a different type of technical challenge.
For most states, there was NO GIS file available. For the few that were available, they were typically in a different format, and had to be converted. That may have been a simple file format conversion (harder than it sounds) or a geographic projection conversion (in order to match the geographic file with the census data attached). In some cases, there was a written LAW that had to be converted into a digital geographic file. In a few cases, paper maps had to be redrawn in the GIS software with accurate geographic coordinates (again, to coincide with the geographic file with census data attached). In one case, there was a 100 page bound book that listed census blocks for each district. I had to cut the pages out and scan the book, page by page, OCR (Optical Character Recognition – convert each printed page to a digital format) – at a time when OCR was in its infancy – then create a database to link each line of the book to a census block and program the computer to “build” the geographic features. At one point in the process, I had six desktop computers running different processes on different states, because processing of one procedure might take up to one week to complete.
In the 2020’s, GIS is commonplace. But, 30 years ago, it was leading edge technology. EVERY state file that I created began with TIGR files. These were computer files with points and line segments that could be used to build various types of lines (like roads and streams) and boundaries for states, counties, cities, etc. But, there were NO boundaries for State Legislature Districts.
Along with the TIGR files, we used Census STF (Summary Tape File) files. These are the finalized data from the decennial census. Data in these files is aggregated at multiple levels: State, county, city, census tract, census block, etc. The data had to be linked accurately between the geographic files and the census data files. Since there was NEVER any census data for state legislature districts, our GIS software was used to aggregate the census data from different combination of county, census tract or census block data. This could take hours or days for each state.
The two books containing data about state legislature districts credit me with doing the “heavy lifting” in preparation of the book. In addition to creating the boundaries and aggregating the data, I assisted in designing the computers we used for the process and I developed an automated process to convert the aggregated data into the format of the desktop publishing software, so that the data in hundreds of rows of data would not have to be entered manually.
Below: Two particularly egregious cases of gerrymandering in North Carolina and Florida from Book 1


The following two books showed demographics of State Legislature Districts, using maps and tables.
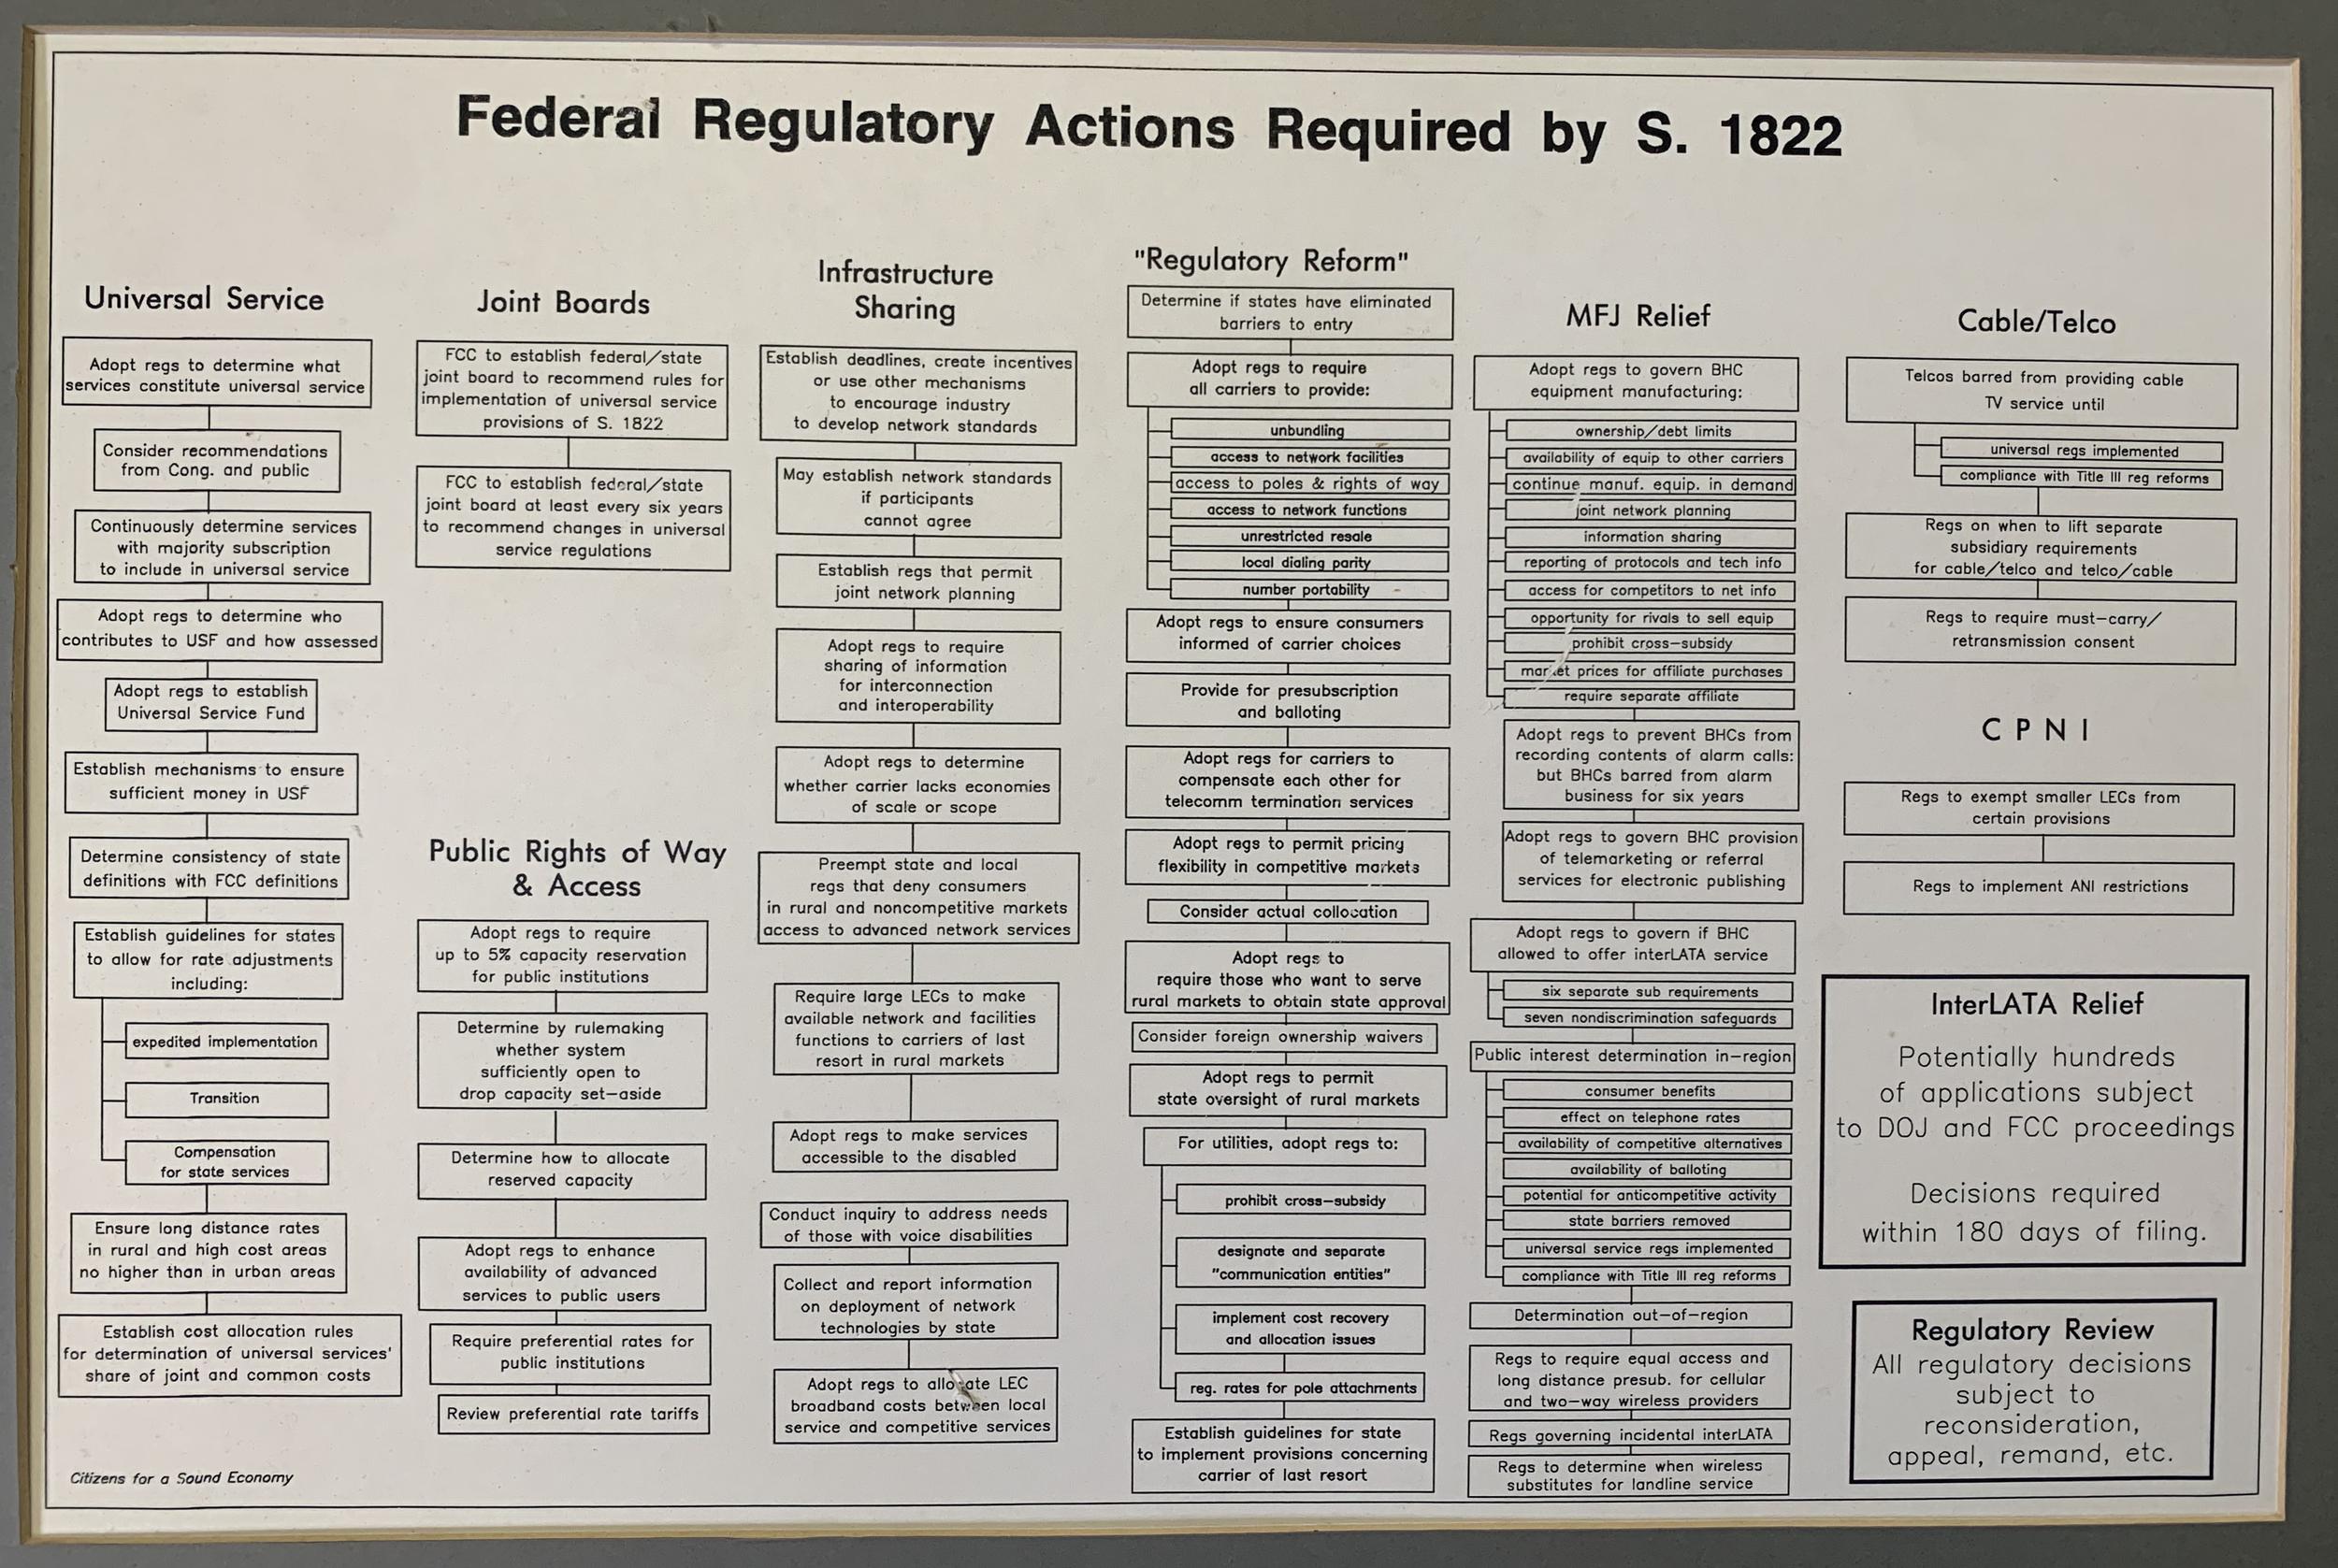
Besides this HUGE mapping and data aggregation project, I worked on many other smaller projects, two of which are particularly interesting. The first was related to the “information superhighway.” I created a graphic which was used in a Congressional Hearing. (shown below). Another was a graphic I created for a campaign against the “information superhighway” which was published in a full page advertisement in the Wall Street Journal.

