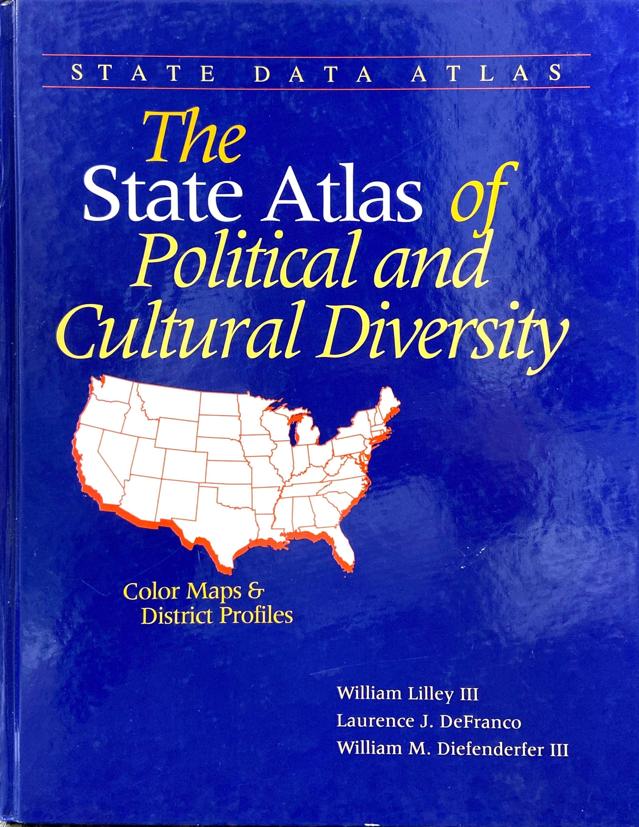
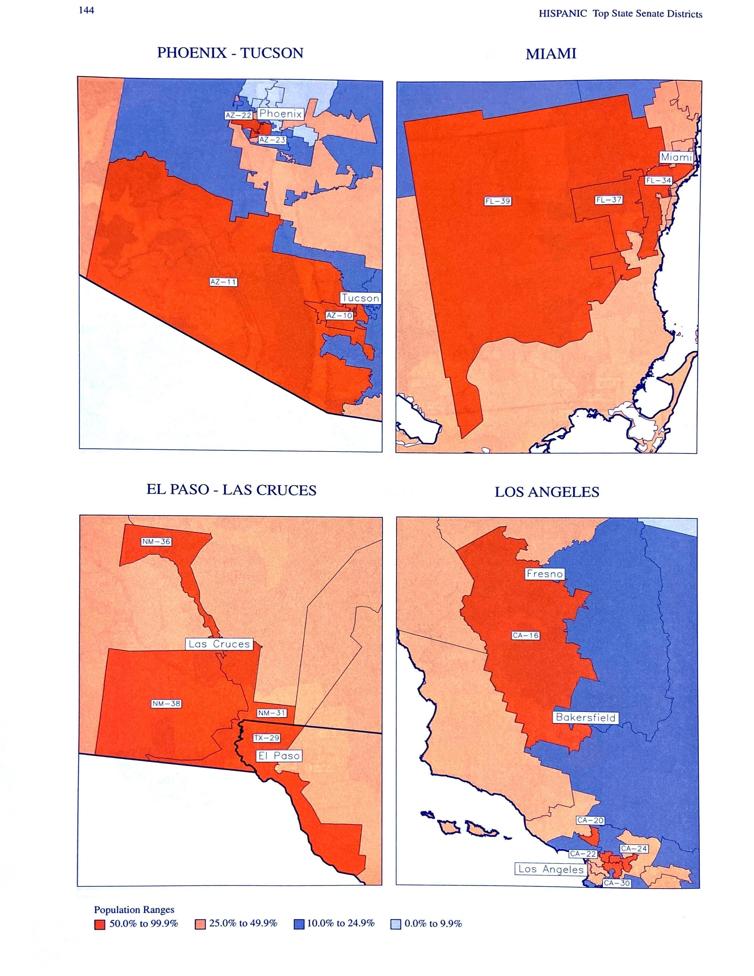
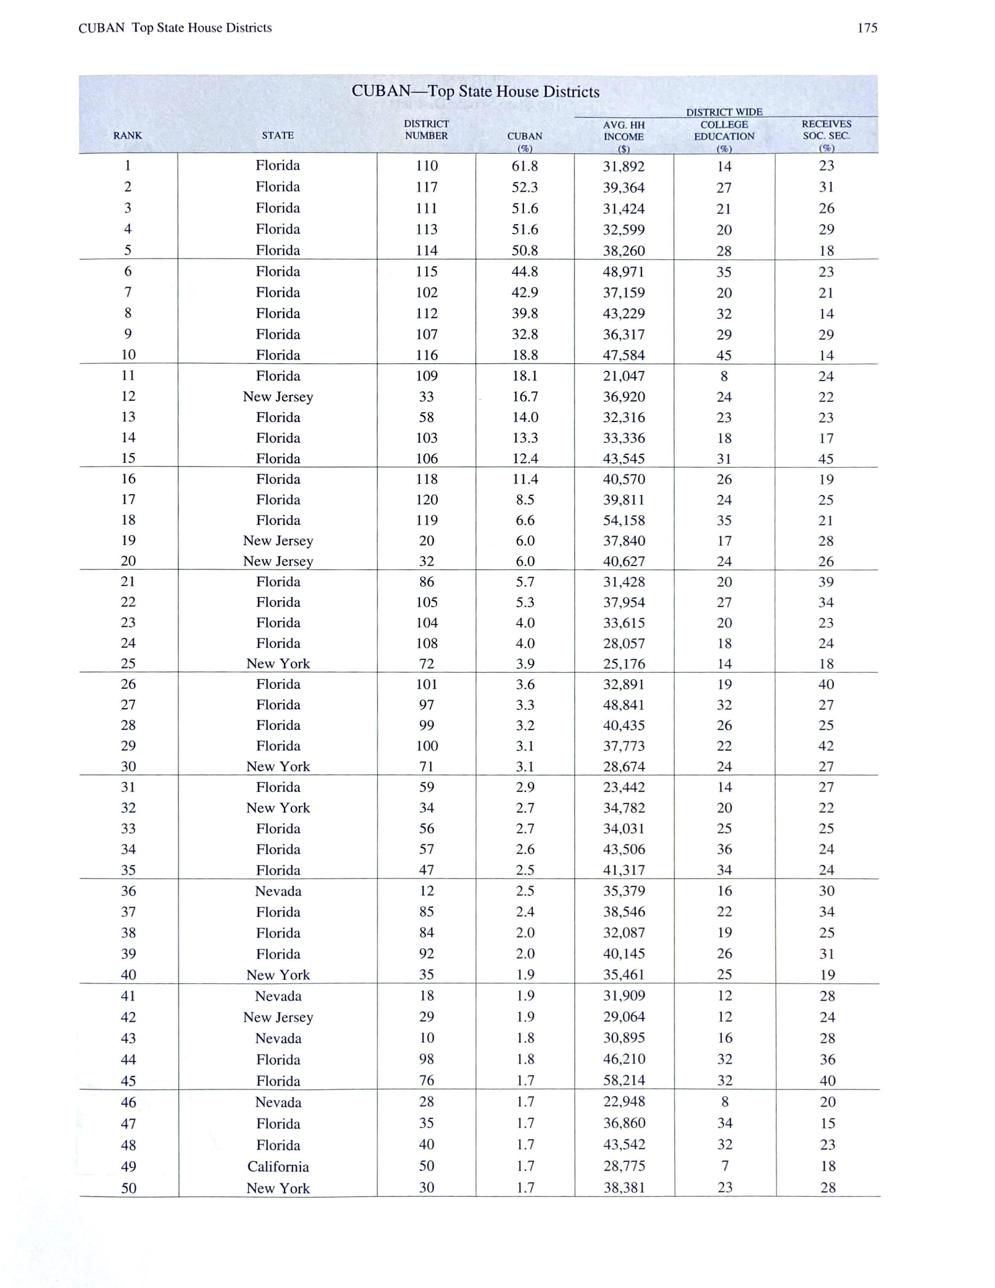
This volume shows graphically, in color, on maps, where there are racial and national origin concentrations of populations, as compared to State Legislature Districts. Tables in the book list the top 50 districts with the highest concentrations for each demographic classification.
Tom Vail is listed here as doing the “heavy lifting.” My function in the project for three books (plus other economic and demographic analysis) included data file conversion, data aggregation (via software), computer graphics, computer programming, computer hardware and software design.
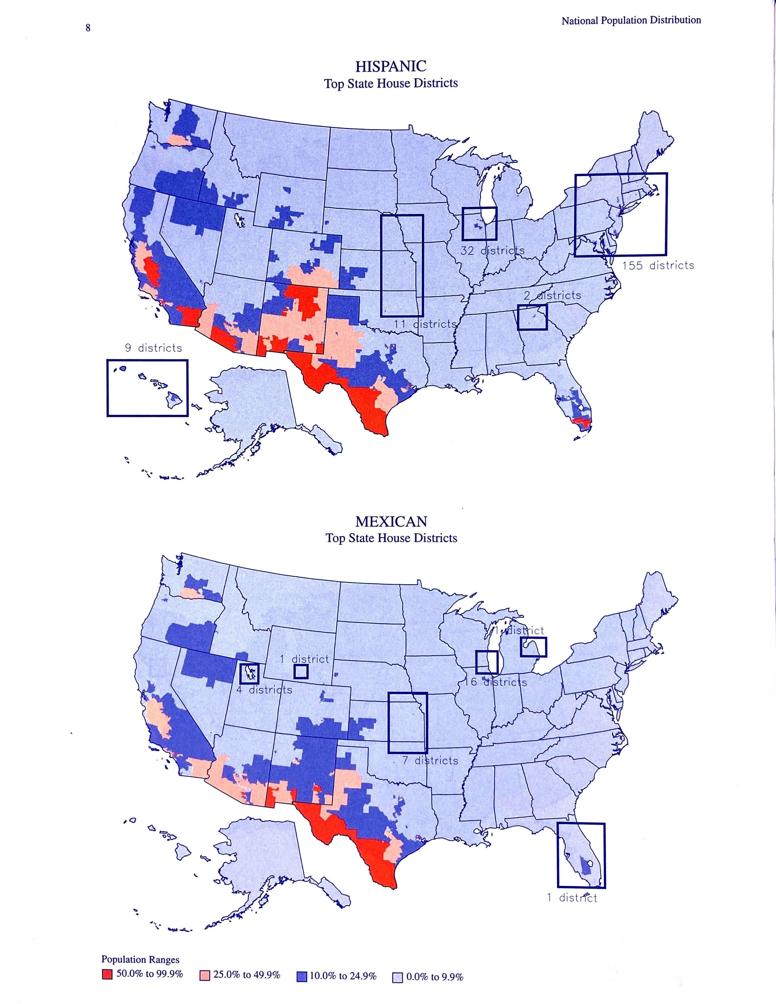
The highest concentration of Mexican population is in the southwest. Not surprising.
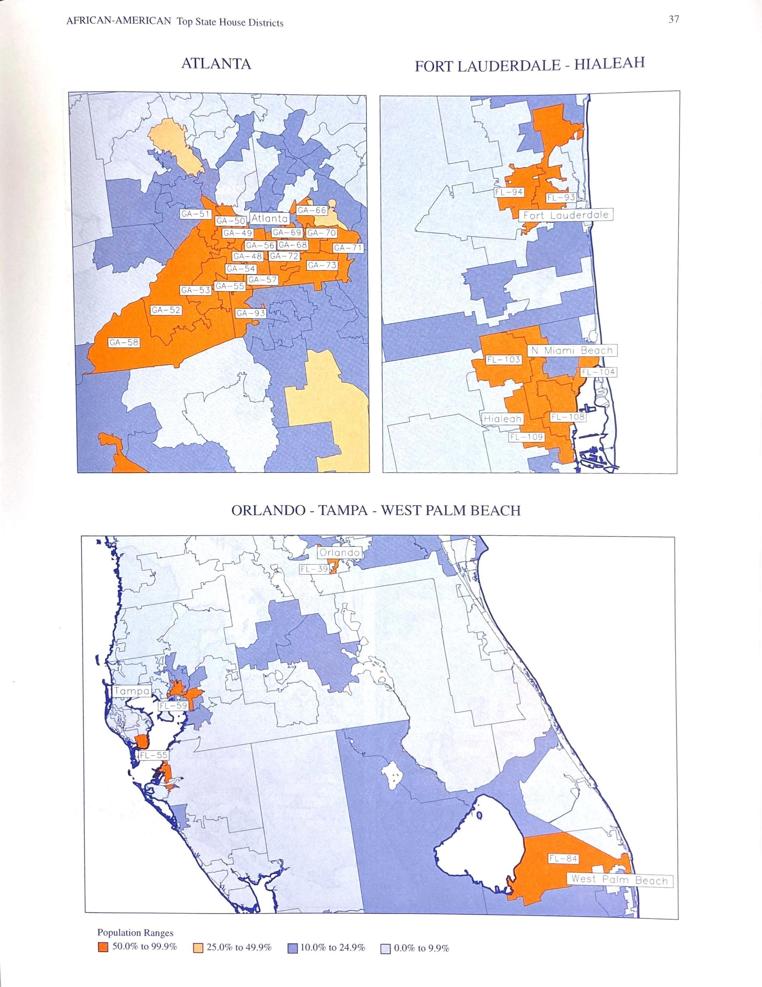
Several examples of the high concentration of black population around cities. Not surprising.
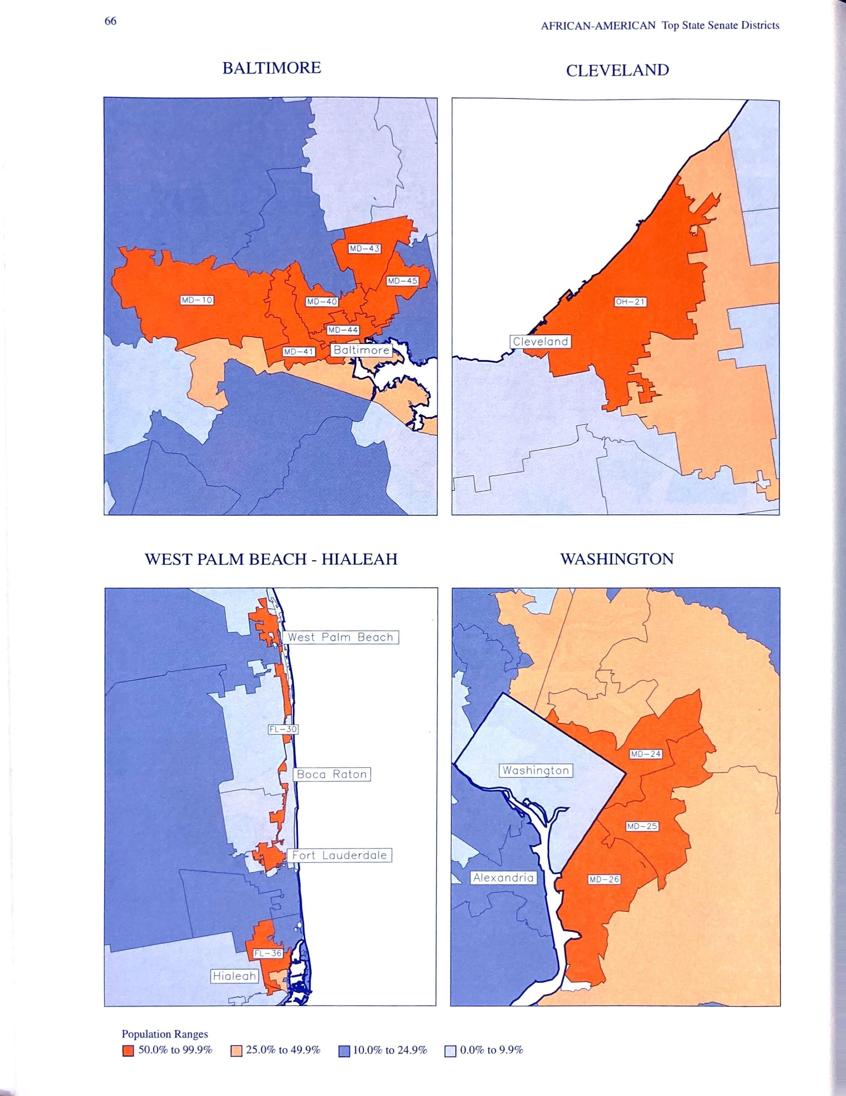
Several more examples of high concentration of black population around cities. Not really surprising. But, the shape of FL-30 shows an obvious struggle to create a district with high density of black population.
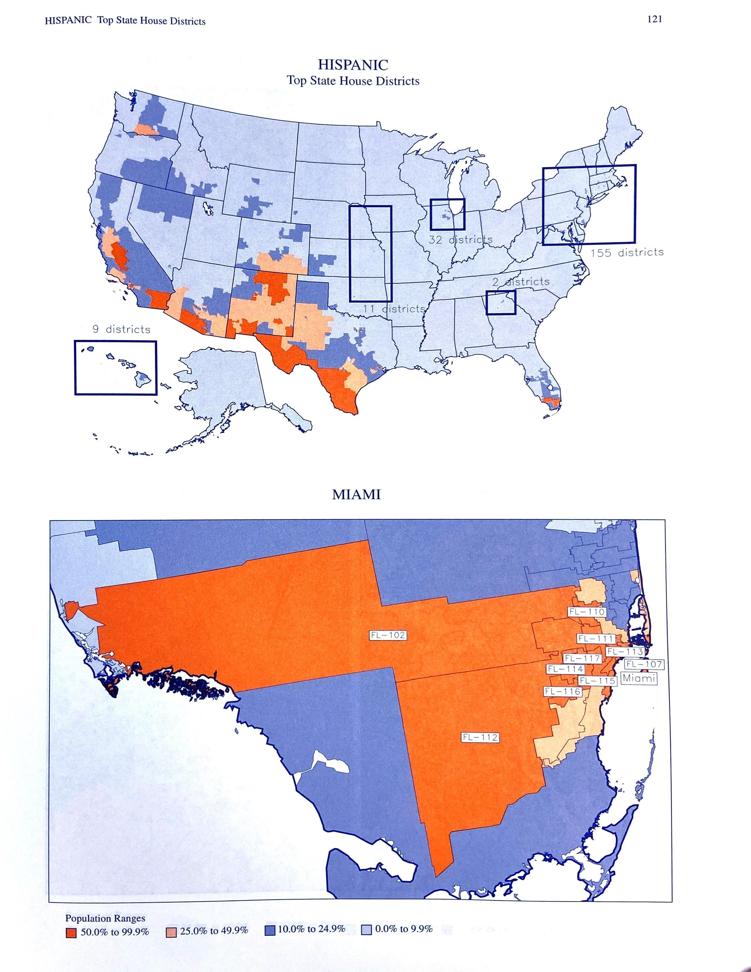
Hispanic population in the US is driven by Mexican, Cuban and Puerto Rican. The locations of the concentrations of these populations is mostly well known.
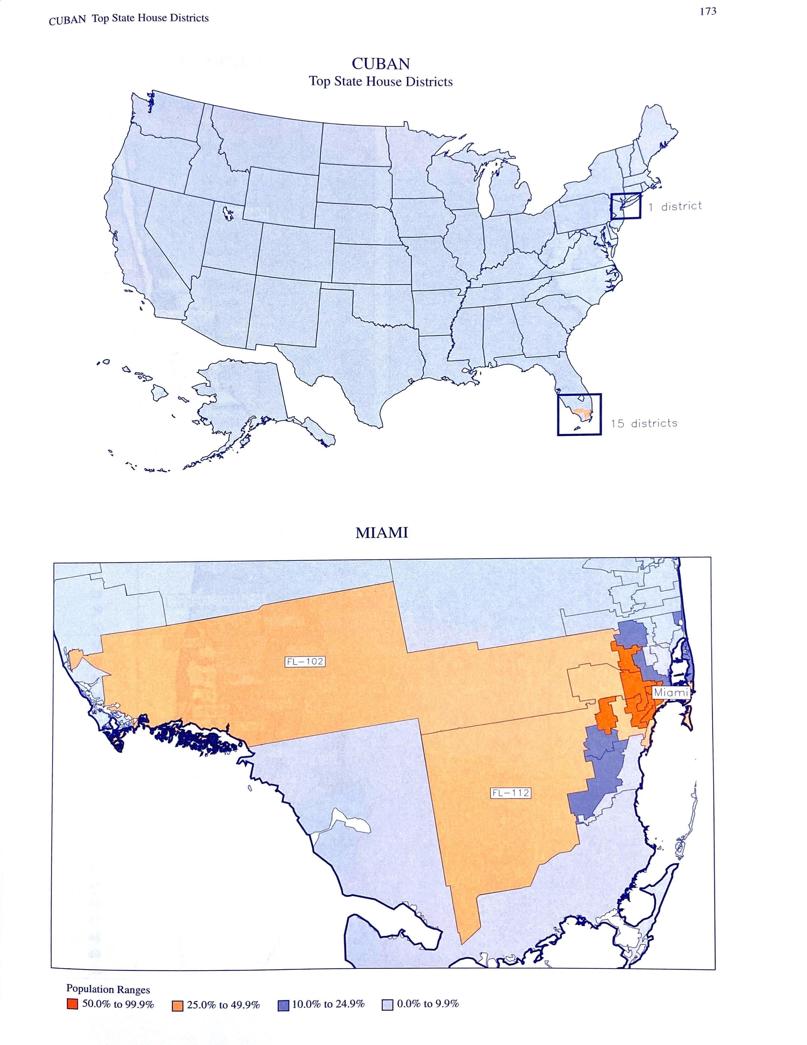
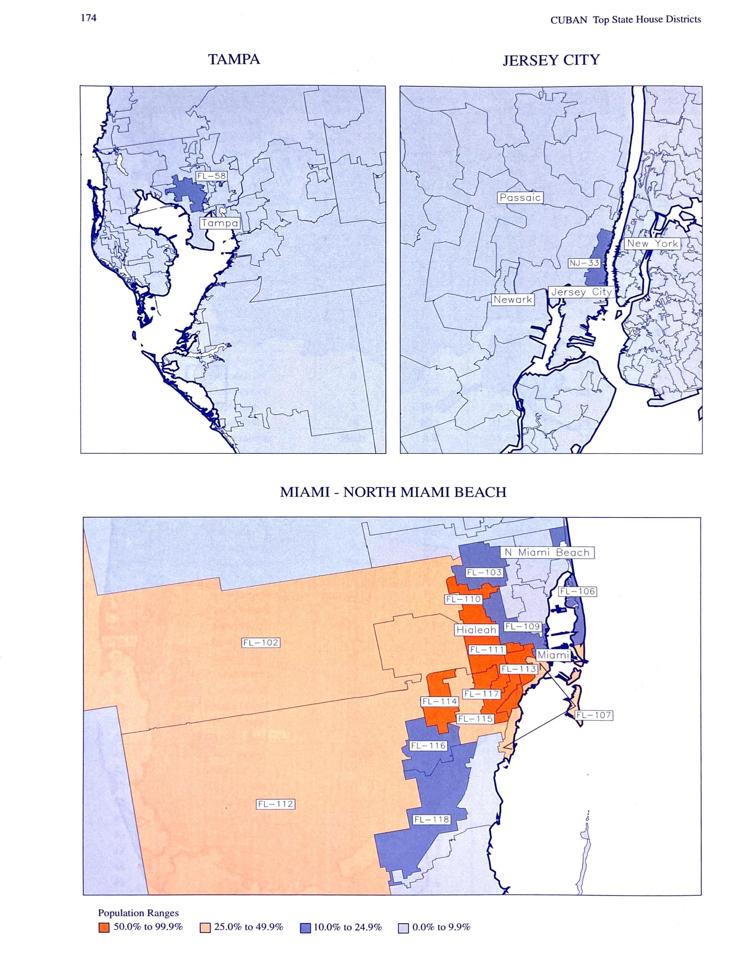
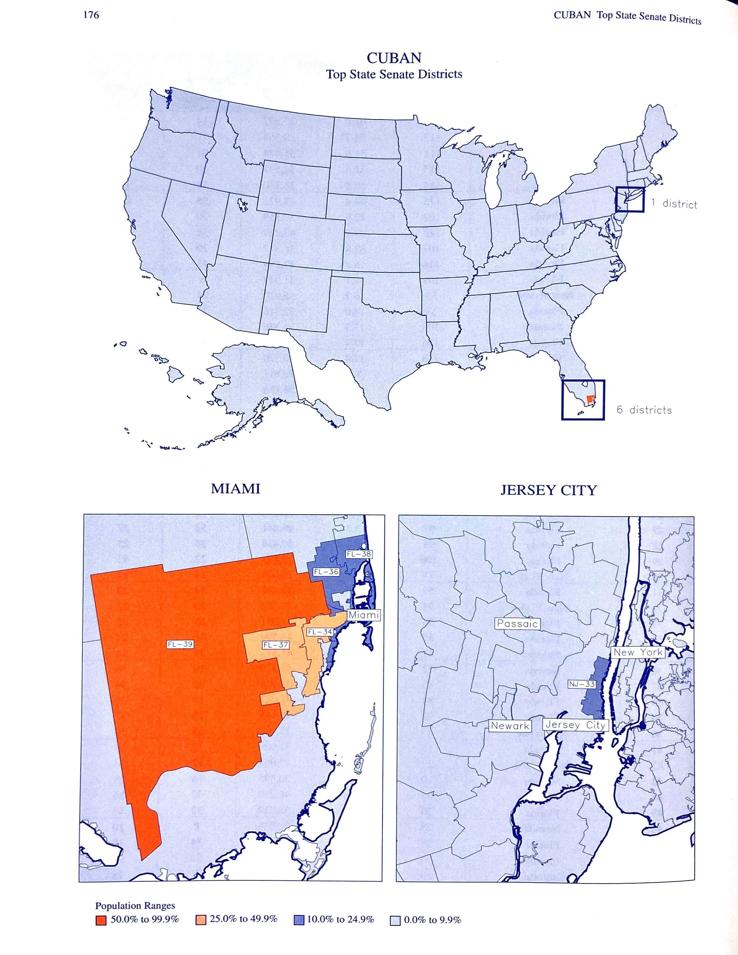
Cuban population in the US is concentrated around Miami.
Of the top 50 State House Districts with the highest concentration of Cubans, most are in Florida.
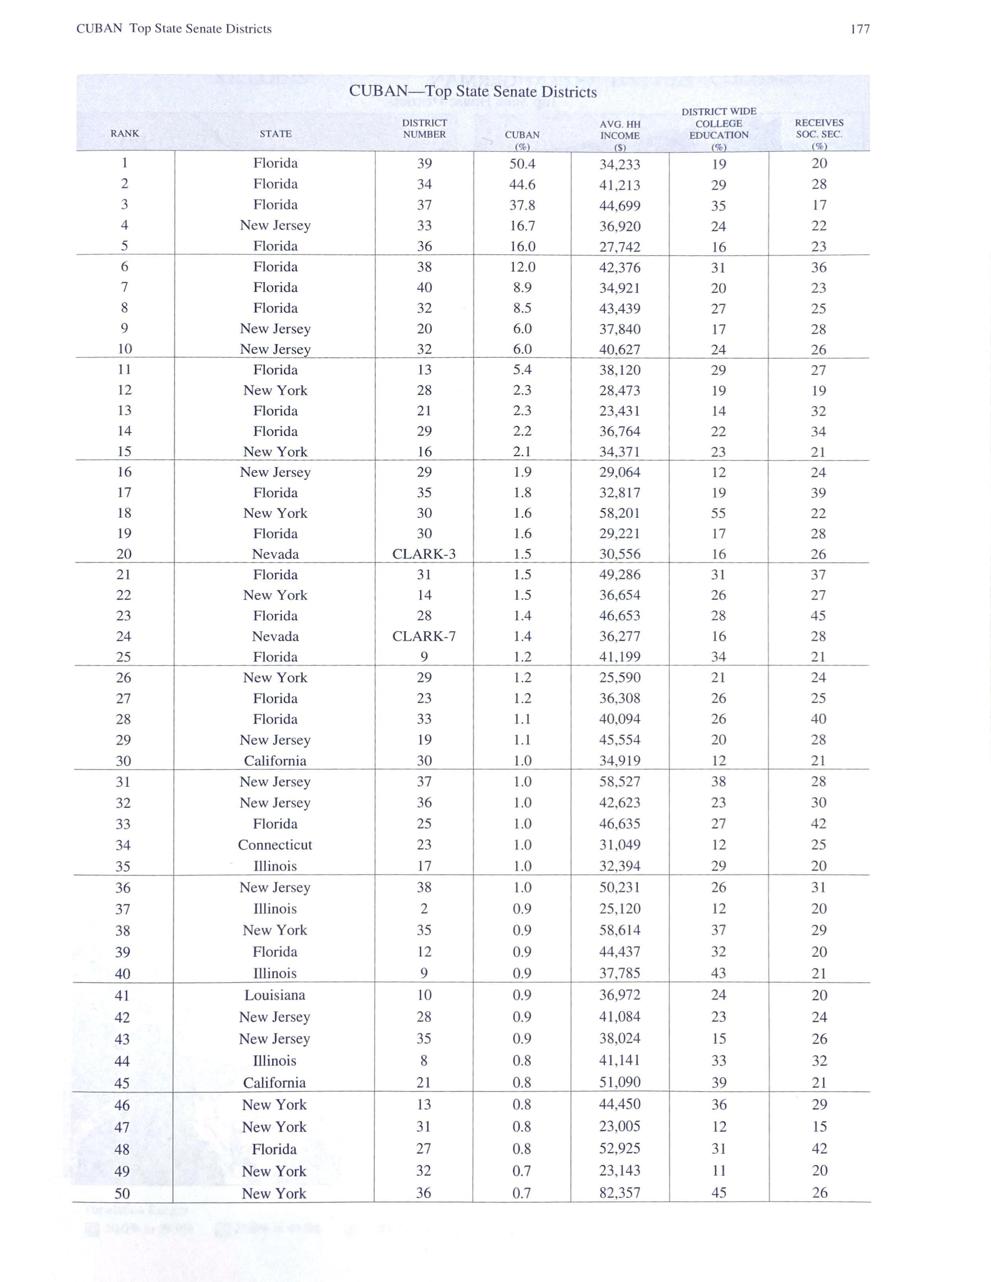
Of the top 50 State Senate Districts with the highest concentration of Cubans, most are in Florida.

